The Highway Loss Data Institute (HLDI) recently took a look at the country’s changing demographics to see how insurance claim rates might be affected. Despite the fact that drivers in their 70s and 80s have higher claim rates than those in their 50s and 60s, the analysis shows that the growth of the older population won’t cause an increase in collision claim rates overall. That is in part because, even with a large increase, the number of older drivers is predicted to remain relatively small. In addition, the increase in the proportion of older drivers will be accompanied by a decrease in the proportion of drivers under 30, who have the highest claim rates of all.
“Age-related impairments can affect a person’s driving, so concern over the country’s changing demographic makeup is understandable,” says HLDI Vice President Matt Moore. “However, when we look at the overall number of claims, this isn’t the looming crisis some have made it out to be.”
Crashes in which elderly drivers apparently lose control of their vehicles grab headlines from time to time. In one recent example, a 100-year-old man in Los Angeles backed into a crowd outside a school in August, injuring 11 children and three adults. Such incidents create an impression of older drivers as a menace, but contrary to expectations, older drivers aren’t causing more crashes than they used to (see Status Report, June 19, 2010, at iihs.org).
Per mile traveled, rates of fatal crashes and all police-reported crashes begin rising around age 70. However, in recent years older drivers’ crash rates have fallen faster than the crash rates of middle-age drivers. The rate of fatal crashes per licensed driver 70 and older fell about 37 percent from 1997 to 2008, a 2010 study by the Insurance Institute for Highway Safety (IIHS) showed. The reasons aren’t well understood, but there is evidence that older drivers tend to limit the amount they drive, particularly at night or in other situations they find challenging.
For the latest analysis, HLDI looked at claim rates by age group under collision insurance, which covers damage to an at-fault driver’s vehicle caused by a crash. Claim frequency is the number of claims relative to the number of insured vehicle years. An insured vehicle year is one vehicle insured for one year, two for six months each, etc.
Analysts calculated the relationship between the population in each age group and the number of rated drivers of that age in HLDI’s database. (A rated driver is the person assigned to a vehicle for insurance purposes, usually the one most likely to be driving the vehicle.) That allowed them to estimate how the population of insured drivers will change, given the predicted shifts in the nation’s overall demographic makeup. They then combined the information on claim rates by age with the predicted changes in the insured driver population to estimate what the overall claim frequency would look like in 30 years.
HLDI’s database includes vehicles from the 10 most current model years insured by companies that supply data to HLDI. Nearly half of all registered vehicles are from the past 10 model years, according to R.L. Polk & Co. Insurers that provide data to HLDI make up more than 80 percent of the market for private passenger automobile insurance.
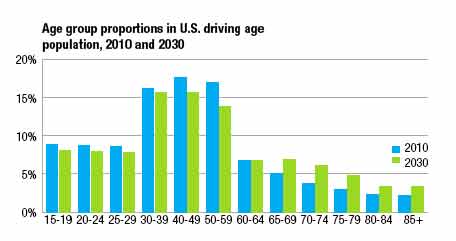
It is possible that crash rates and the effect of demographic changes on them will be different for the wider population that includes drivers of older vehicles or vehicles without collision insurance. Owners of those vehicles may drive differently from the people in the study, and some types of drivers, including older ones, may be more likely to have older vehicles. The U.S. driving-age population (15 and older) is expected to increase by nearly one-fifth from 2010 to 2030, when it is predicted to reach 291 million. As it grows, its makeup will change. Specifically, as the baby boom generation ages, the population is skewing older. Each five-year age group from 15 to 64 will make up a smaller portion of the total driving-age population in 2030 than in 2010. In contrast, the 65-69, 70-74, 75-79, 80-84 and 85-plus age groups are all expected to account for larger percentages.
Not everyone who can legally drive chooses to get a license or own a car, and age is a factor in that. The ratio of rated drivers in HLDI’s database to population, referred to as the insured driver rate, starts out low and peaks at 60-64, with a ratio of more than 0.4. By 85 plus, it has declined to 0.15.
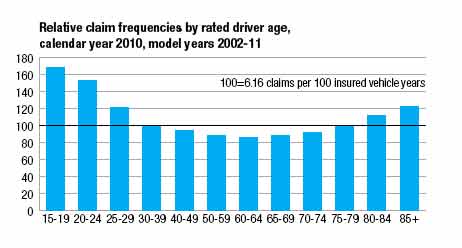
The frequency of collision claims in HLDI’s database is highest for drivers ages 15-19, at nearly 70 percent above average. Frequency steadily declines with age, reaching its lowest level in the 60-64 group, so that the people most likely to be rated drivers are least likely to file collision claims. Frequency then begins to climb again but never approaches the level of teenagers.
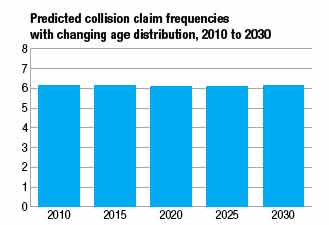
Assuming the insured driver rate and claim frequency in each age group remain the same, the changing demographic makeup will have virtually no effect on the overall collision claim frequency during the next two decades, the analysis shows. Claim frequency will hover between 6.12 claims per 100 insured vehicle years and 6.16 — essentially flat. In absolute numbers, there still may be more crashes in the future, but that is because more people will be driving, not because more of the drivers are older.
The study looks only at collision claims, the majority of which are for low-severity crashes. It doesn’t offer any predictions about serious crashes or fatalities. Older drivers have higher rates of fatal crashes in large part because their fragility makes them more likely than other drivers to die when a crash occurs. It is possible that the coming demographic changes could result in a higher overall rate of fatal crashes. On the other hand, improvements in the health of older drivers might make them less likely to be killed in crashes than they are now. Previous research by IIHS found that older drivers are not only less likely to be involved in crashes than they used to be, theyare less likely to be killed or seriously injured when they do crash (see Status Report, June 19, 2010).
HLDI analysts considered what would happen to collision claims if more older people continue driving as a result of improved health and mobility. Increasing the insured driver rate 20 percent for people 65 and older didn’t change overall claim frequency.
Even under an extreme scenario in which the 75 and older group has an insured driver rate of 99 percent, claim frequency combined across all ages would increase only 2 percent to 6.29. Meanwhile, a 20 percent increase in claim frequency for drivers 75 and older also would result in only a tiny increase in overall claim frequency.
 Current trends in HLDI data have the overall claim rate decreasing. If this trend is factored into the calculations looking at age distribution, claim frequency actually will be lower in 2030 than in 2010.
“On an individual level, aging drivers present challenges for their families and state licensing officials, but overall they aren’t really changing the highway safety landscape,” says Adrian Lund, president of HLDI and IIHS. “Society needs to consider how to deal with age-related impairments among drivers, but major reductions in crash and injury risk will come from road and vehicle engineering improvements that can bring increased safety for everyone, young and old.”


